OPNFV Barometer User Guide
Barometer collectd plugins description
Collectd is a daemon which collects system performance statistics periodically and provides a variety of mechanisms to publish the collected metrics. It supports more than 90 different input and output plugins. Input plugins retrieve metrics and publish them to the collectd deamon, while output plugins publish the data they receive to an end point. collectd also has infrastructure to support thresholding and notification.
Barometer has enabled the following collectd plugins:
dpdkstat plugin: A read plugin that retrieves stats from the DPDK extended NIC stats API.
dpdkevents plugin: A read plugin that retrieves DPDK link status and DPDK forwarding cores liveliness status (DPDK Keep Alive).
gnocchi plugin: A write plugin that pushes the retrieved stats to Gnocchi. It’s capable of pushing any stats read through collectd to Gnocchi, not just the DPDK stats.
aodh plugin: A notification plugin that pushes events to Aodh, and creates/updates alarms appropriately.
hugepages plugin: A read plugin that retrieves the number of available and free hugepages on a platform as well as what is available in terms of hugepages per socket.
Open vSwitch events Plugin: A read plugin that retrieves events from OVS.
Open vSwitch stats Plugin: A read plugin that retrieves flow and interface stats from OVS.
mcelog plugin: A read plugin that uses mcelog client protocol to check for memory Machine Check Exceptions and sends the stats for reported exceptions.
PMU plugin: A read plugin that provides performance counters data on Intel CPUs using Linux perf interface.
RDT plugin: A read plugin that provides the last level cache utilization and memory bandwidth utilization.
virt: A read plugin that uses virtualization API libvirt to gather statistics about virtualized guests on a system directly from the hypervisor, without a need to install collectd instance on the guest.
SNMP Agent: A write plugin that will act as a AgentX subagent that receives and handles queries from SNMP master agent and returns the data collected by read plugins. The SNMP Agent plugin handles requests only for OIDs specified in configuration file. To handle SNMP queries the plugin gets data from collectd and translates requested values from collectd’s internal format to SNMP format. Supports SNMP: get, getnext and walk requests.
All the plugins above are available on the collectd master, except for the Gnocchi and Aodh plugins as they are Python-based plugins and only C plugins are accepted by the collectd community. The Gnocchi and Aodh plugins live in the OpenStack repositories.
Other plugins existing as a pull request into collectd master:
Legacy/IPMI: A read plugin that reports platform thermals, voltages, fanspeed, current, flow, power etc. Also, the plugin monitors Intelligent Platform Management Interface (IPMI) System Event Log (SEL) and sends the appropriate notifications based on monitored SEL events.
PCIe AER: A read plugin that monitors PCIe standard and advanced errors and sends notifications about those errors.
Third party application in Barometer repository:
Open vSwitch PMD stats: An aplication that retrieves PMD stats from OVS. It is run through exec plugin.
Plugins and application included in the Euphrates release:
Write Plugins: aodh plugin, SNMP agent plugin, gnocchi plugin.
Read Plugins/application: Intel RDT plugin, virt plugin, Open vSwitch stats plugin, Open vSwitch PMD stats application.
Collectd capabilities and usage
Note
Plugins included in the OPNFV E release will be built-in for Apex integration and can be configured as shown in the examples below.
The collectd plugins in OPNFV are configured with reasonable defaults, but can be overridden.
Building all Barometer upstreamed plugins from scratch
The plugins that have been merged to the collectd master branch can all be built and configured through the barometer repository.
Note
sudo permissions are required to install collectd.
These instructions are for Centos 7.
To build all the upstream plugins, clone the barometer repo:
$ git clone https://gerrit.opnfv.org/gerrit/barometer
To install collectd as a service and install all it’s dependencies:
$ cd barometer/systems && ./build_base_machine.sh
This will install collectd as a service and the base install directory will be /opt/collectd.
Sample configuration files can be found in ‘/opt/collectd/etc/collectd.conf.d’
Note
If you don’t want to use one of the Barometer plugins, simply remove the sample config file from ‘/opt/collectd/etc/collectd.conf.d’
Note
If you plan on using the Exec plugin (for OVS_PMD_STATS or for executing scripts on notification generation), the plugin requires a non-root user to execute scripts. By default, collectd_exec user is used in the exec.conf provided in the sample configurations directory under src/collectd in the Barometer repo. These scripts DO NOT create this user. You need to create this user or modify the configuration in the sample configurations directory under src/collectd to use another existing non root user before running build_base_machine.sh.
Note
If you are using any Open vSwitch plugins you need to run:
$ sudo ovs-vsctl set-manager ptcp:6640
After this, you should be able to start collectd as a service
$ sudo systemctl status collectd
If you want to use granfana to display the metrics you collect, please see: grafana guide
For more information on configuring and installing OpenStack plugins for collectd, check out the collectd-openstack-plugins GSG.
Below is the per plugin installation and configuration guide, if you only want to install some/particular plugins.
DPDK plugins
Repo: https://github.com/collectd/collectd
Branch: master
Dependencies: DPDK (http://dpdk.org/)
Note
DPDK statistics plugin requires DPDK version 16.04 or later.
To build and install DPDK to /usr please see: https://github.com/collectd/collectd/blob/master/docs/BUILD.dpdkstat.md
Building and installing collectd:
$ git clone https://github.com/collectd/collectd.git
$ cd collectd
$ ./build.sh
$ ./configure --enable-syslog --enable-logfile --enable-debug
$ make
$ sudo make install
Note
If DPDK was installed in a non standard location you will need to specify paths to the header files and libraries using LIBDPDK_CPPFLAGS and LIBDPDK_LDFLAGS. You will also need to add the DPDK library symbols to the shared library path using ldconfig. Note that this update to the shared library path is not persistant (i.e. it will not survive a reboot).
Example of specifying custom paths to DPDK headers and libraries:
$ ./configure LIBDPDK_CPPFLAGS="path to DPDK header files" LIBDPDK_LDFLAGS="path to DPDK libraries"
This will install collectd to default folder /opt/collectd. The collectd
configuration file (collectd.conf) can be found at /opt/collectd/etc.
To configure the dpdkstats plugin you need to modify the configuration file to
include:
LoadPlugin dpdkstat
<Plugin dpdkstat>
   Coremask "0xf"
   ProcessType "secondary"
   FilePrefix "rte"
   EnabledPortMask 0xffff
   PortName "interface1"
   PortName "interface2"
</Plugin>
To configure the dpdkevents plugin you need to modify the configuration file to include:
<LoadPlugin dpdkevents>
  Interval 1
</LoadPlugin>

<Plugin "dpdkevents">
  <EAL>
    Coremask "0x1"
    MemoryChannels "4"
    FilePrefix "rte"
  </EAL>
  <Event "link_status">
    SendEventsOnUpdate false
    EnabledPortMask 0xffff
    SendNotification true
  </Event>
  <Event "keep_alive">
    SendEventsOnUpdate false
    LCoreMask "0xf"
    KeepAliveShmName "/dpdk_keepalive_shm_name"
    SendNotification true
  </Event>
</Plugin>
Note
Currently, the DPDK library doesn’t support API to de-initialize the DPDK resources allocated on the initialization. It means, the collectd plugin will not be able to release the allocated DPDK resources (locks/memory/pci bindings etc.) correctly on collectd shutdown or reinitialize the DPDK library if primary DPDK process is restarted. The only way to release those resources is to terminate the process itself. For this reason, the plugin forks off a separate collectd process. This child process becomes a secondary DPDK process which can be run on specific CPU cores configured by user through collectd configuration file (“Coremask” EAL configuration option, the hexadecimal bitmask of the cores to run on).
For more information on the plugin parameters, please see: https://github.com/collectd/collectd/blob/master/src/collectd.conf.pod
Note
dpdkstat plugin initialization time depends on read interval. It requires 5 read cycles to set up internal buffers and states, during that time no statistics are submitted. Also, if plugin is running and the number of DPDK ports is increased, internal buffers are resized. That requires 3 read cycles and no port statistics are submitted during that time.
The Address-Space Layout Randomization (ASLR) security feature in Linux should be disabled, in order for the same hugepage memory mappings to be present in all DPDK multi-process applications.
To disable ASLR:
$ sudo echo 0 > /proc/sys/kernel/randomize_va_space
To fully enable ASLR:
$ sudo echo 2 > /proc/sys/kernel/randomize_va_space
Warning
Disabling Address-Space Layout Randomization (ASLR) may have security implications. It is recommended to be disabled only when absolutely necessary, and only when all implications of this change have been understood.
For more information on multi-process support, please see: http://dpdk.org/doc/guides/prog_guide/multi_proc_support.html
DPDK stats plugin limitations:
The DPDK primary process application should use the same version of DPDK that collectd DPDK plugin is using;
L2 statistics are only supported;
The plugin has been tested on Intel NIC’s only.
DPDK stats known issues:
DPDK port visibility
When network port controlled by Linux is bound to DPDK driver, the port will not be available in the OS. It affects the SNMP write plugin as those ports will not be present in standard IF-MIB. Thus, additional work is required to be done to support DPDK ports and statistics.
Hugepages Plugin
Repo: https://github.com/collectd/collectd
Branch: master
Dependencies: None, but assumes hugepages are configured.
To configure some hugepages:
$ sudo mkdir -p /mnt/huge
$ sudo mount -t hugetlbfs nodev /mnt/huge
$ sudo bash -c "echo 14336 > /sys/devices/system/node/node0/hugepages/hugepages-2048kB/nr_hugepages"
Building and installing collectd:
$ git clone https://github.com/collectd/collectd.git
$ cd collectd
$ ./build.sh
$ ./configure --enable-syslog --enable-logfile --enable-hugepages --enable-debug
$ make
$ sudo make install
This will install collectd to default folder /opt/collectd. The collectd
configuration file (collectd.conf) can be found at /opt/collectd/etc.
To configure the hugepages plugin you need to modify the configuration file to
include:
LoadPlugin hugepages
<Plugin hugepages>
    ReportPerNodeHP  true
    ReportRootHP     true
    ValuesPages      true
    ValuesBytes      false
    ValuesPercentage false
</Plugin>
For more information on the plugin parameters, please see: https://github.com/collectd/collectd/blob/master/src/collectd.conf.pod
Intel PMU Plugin
Repo: https://github.com/collectd/collectd
Branch: master
Dependencies:
PMU tools (jevents library) https://github.com/andikleen/pmu-tools
To be suitable for use in collectd plugin shared library libjevents should be compiled as position-independent code. To do this add the following line to pmu-tools/jevents/Makefile:
CFLAGS += -fPIC
Building and installing jevents library:
$ git clone https://github.com/andikleen/pmu-tools.git
$ cd pmu-tools/jevents/
$ make
$ sudo make install
Download the Hardware Events that are relevant to your CPU, download the appropriate CPU event list json file:
$ wget https://raw.githubusercontent.com/andikleen/pmu-tools/master/event_download.py
$ python event_download.py
This will download the json files to the location: $HOME/.cache/pmu-events/. If you don’t want to download these files to the aforementioned location, set the environment variable XDG_CACHE_HOME to the location you want the files downloaded to.
Building and installing collectd:
$ git clone https://github.com/collectd/collectd.git
$ cd collectd
$ ./build.sh
$ ./configure --enable-syslog --enable-logfile --with-libjevents=/usr/local --enable-debug
$ make
$ sudo make install
This will install collectd to default folder /opt/collectd. The collectd
configuration file (collectd.conf) can be found at /opt/collectd/etc.
To configure the PMU plugin you need to modify the configuration file to
include:
<LoadPlugin intel_pmu>
  Interval 1
</LoadPlugin>
<Plugin "intel_pmu">
  ReportHardwareCacheEvents true
  ReportKernelPMUEvents true
  ReportSoftwareEvents true
  Cores ""
</Plugin>
If you want to monitor Intel CPU specific CPU events, make sure to enable the additional two options shown below:
<Plugin intel_pmu>
 ReportHardwareCacheEvents true
 ReportKernelPMUEvents true
 ReportSoftwareEvents true
 EventList "$HOME/.cache/pmu-events/GenuineIntel-6-2D-core.json"
 HardwareEvents "L2_RQSTS.CODE_RD_HIT,L2_RQSTS.CODE_RD_MISS" "L2_RQSTS.ALL_CODE_RD"
 Cores ""
</Plugin>
Note
If you set XDG_CACHE_HOME to anything other than the variable above - you will need to modify the path for the EventList configuration.
Use “Cores” option to monitor metrics only for configured cores. If an empty string is provided as value for this field default cores configuration is applied - that is all available cores are monitored separately. To limit monitoring to cores 0-7 set the option as shown below:
Cores "[0-7]"
For more information on the plugin parameters, please see: https://github.com/collectd/collectd/blob/master/src/collectd.conf.pod
Note
The plugin opens file descriptors whose quantity depends on number of monitored CPUs and number of monitored counters. Depending on configuration, it might be required to increase the limit on the number of open file descriptors allowed. This can be done using ‘ulimit -n’ command. If collectd is executed as a service ‘LimitNOFILE=’ directive should be defined in [Service] section of collectd.service file.
Intel RDT Plugin
Repo: https://github.com/collectd/collectd
Branch: master
Dependencies:
PQoS/Intel RDT library https://github.com/01org/intel-cmt-cat.git
msr kernel module
Building and installing PQoS/Intel RDT library:
$ git clone https://github.com/01org/intel-cmt-cat.git
$ cd intel-cmt-cat
$ make
$ make install PREFIX=/usr
You will need to insert the msr kernel module:
$ modprobe msr
Building and installing collectd:
$ git clone https://github.com/collectd/collectd.git
$ cd collectd
$ ./build.sh
$ ./configure --enable-syslog --enable-logfile --with-libpqos=/usr/ --enable-debug
$ make
$ sudo make install
This will install collectd to default folder /opt/collectd. The collectd
configuration file (collectd.conf) can be found at /opt/collectd/etc.
To configure the RDT plugin you need to modify the configuration file to
include:
<LoadPlugin intel_rdt>
  Interval 1
</LoadPlugin>
<Plugin "intel_rdt">
  Cores ""
</Plugin>
For more information on the plugin parameters, please see: https://github.com/collectd/collectd/blob/master/src/collectd.conf.pod
IPMI Plugin
Repo: https://github.com/collectd/collectd
Branch: feat_ipmi_events, feat_ipmi_analog
Dependencies: OpenIPMI library (http://openipmi.sourceforge.net/)
The IPMI plugin is already implemented in the latest collectd and sensors like temperature, voltage, fanspeed, current are already supported there. The list of supported IPMI sensors has been extended and sensors like flow, power are supported now. Also, a System Event Log (SEL) notification feature has been introduced.
The feat_ipmi_events branch includes new SEL feature support in collectd IPMI plugin. If this feature is enabled, the collectd IPMI plugin will dispatch notifications about new events in System Event Log.
The feat_ipmi_analog branch includes the support of extended IPMI sensors in collectd IPMI plugin.
Install dependencies
On Centos, install OpenIPMI library:
$ sudo yum install OpenIPMI ipmitool
Anyway, it’s recommended to use the latest version of the OpenIPMI library as it includes fixes of known issues which aren’t included in standard OpenIPMI library package. The latest version of the library can be found at https://sourceforge.net/p/openipmi/code/ci/master/tree/. Steps to install the library from sources are described below.
Remove old version of OpenIPMI library:
$ sudo yum remove OpenIPMI ipmitool
Build and install OpenIPMI library:
$ git clone https://git.code.sf.net/p/openipmi/code openipmi-code
$ cd openipmi-code
$ autoreconf --install
$ ./configure --prefix=/usr
$ make
$ sudo make install
Add the directory containing OpenIPMI*.pc files to the PKG_CONFIG_PATH
environment variable:
export PKG_CONFIG_PATH=/usr/lib/pkgconfig
Enable IPMI support in the kernel:
$ sudo modprobe ipmi_devintf
$ sudo modprobe ipmi_si
Note
If HW supports IPMI, the /dev/ipmi0 character device will be
created.
Clone and install the collectd IPMI plugin:
$ git clone https://github.com/collectd/collectd
$ cd collectd
$ ./build.sh
$ ./configure --enable-syslog --enable-logfile --enable-debug
$ make
$ sudo make install
This will install collectd to default folder /opt/collectd. The collectd
configuration file (collectd.conf) can be found at /opt/collectd/etc.
To configure the IPMI plugin you need to modify the file to include:
LoadPlugin ipmi
<Plugin ipmi>
   <Instance "local">
     SELEnabled true # only feat_ipmi_events branch supports this
   </Instance>
</Plugin>
Note
By default, IPMI plugin will read all available analog sensor values, dispatch the values to collectd and send SEL notifications.
For more information on the IPMI plugin parameters and SEL feature configuration, please see: https://github.com/collectd/collectd/blob/master/src/collectd.conf.pod
Extended analog sensors support doesn’t require additional configuration. The usual collectd IPMI documentation can be used:
IPMI documentation:
Mcelog Plugin
Repo: https://github.com/collectd/collectd
Branch: master
Dependencies: mcelog
Start by installing mcelog.
Note
The kernel has to have CONFIG_X86_MCE enabled. For 32bit kernels you need atleast a 2.6,30 kernel.
On Centos:
$ sudo yum install mcelog
Or build from source
$ git clone https://git.kernel.org/pub/scm/utils/cpu/mce/mcelog.git
$ cd mcelog
$ make
... become root ...
$ make install
$ cp mcelog.service /etc/systemd/system/
$ systemctl enable mcelog.service
$ systemctl start mcelog.service
Verify you got a /dev/mcelog. You can verify the daemon is running completely by running:
$ mcelog --client
This should query the information in the running daemon. If it prints nothing that is fine (no errors logged yet). More info @ http://www.mcelog.org/installation.html
Modify the mcelog configuration file “/etc/mcelog/mcelog.conf” to include or enable:
socket-path = /var/run/mcelog-client
[dimm]
dimm-tracking-enabled = yes
dmi-prepopulate = yes
uc-error-threshold = 1 / 24h
ce-error-threshold = 10 / 24h

[socket]
socket-tracking-enabled = yes
mem-uc-error-threshold = 100 / 24h
mem-ce-error-threshold = 100 / 24h
mem-ce-error-log = yes

[page]
memory-ce-threshold = 10 / 24h
memory-ce-log = yes
memory-ce-action = soft

[trigger]
children-max = 2
directory = /etc/mcelog
Clone and install the collectd mcelog plugin:
$ git clone https://github.com/collectd/collectd
$ cd collectd
$ ./build.sh
$ ./configure --enable-syslog --enable-logfile --enable-debug
$ make
$ sudo make install
This will install collectd to default folder /opt/collectd. The collectd
configuration file (collectd.conf) can be found at /opt/collectd/etc.
To configure the mcelog plugin you need to modify the configuration file to
include:
<LoadPlugin mcelog>
  Interval 1
</LoadPlugin>
<Plugin mcelog>
  <Memory>
    McelogClientSocket "/var/run/mcelog-client"
    PersistentNotification false
  </Memory>
  #McelogLogfile "/var/log/mcelog"
</Plugin>
For more information on the plugin parameters, please see: https://github.com/collectd/collectd/blob/master/src/collectd.conf.pod
Simulating a Machine Check Exception can be done in one of 3 ways:
Running $make test in the mcelog cloned directory - mcelog test suite
using mce-inject
using mce-test
mcelog test suite:
It is always a good idea to test an error handling mechanism before it is really needed. mcelog includes a test suite. The test suite relies on mce-inject which needs to be installed and in $PATH.
You also need the mce-inject kernel module configured (with CONFIG_X86_MCE_INJECT=y), compiled, installed and loaded:
$ modprobe mce-inject
Then you can run the mcelog test suite with
$ make test
This will inject different classes of errors and check that the mcelog triggers runs. There will be some kernel messages about page offlining attempts. The test will also lose a few pages of memory in your system (not significant).
Note
This test will kill any running mcelog, which needs to be restarted manually afterwards.
mce-inject:
A utility to inject corrected, uncorrected and fatal machine check exceptions
$ git clone https://git.kernel.org/pub/scm/utils/cpu/mce/mce-inject.git
$ cd mce-inject
$ make
$ modprobe mce-inject
Modify the test/corrected script to include the following:
CPU 0 BANK 0
STATUS 0xcc00008000010090
ADDR 0x0010FFFFFFF
Inject the error: .. code:: bash
$ ./mce-inject < test/corrected
Note
The uncorrected and fatal scripts under test will cause a platform reset. Only the fatal script generates the memory errors**. In order to quickly emulate uncorrected memory errors and avoid host reboot following test errors from mce-test suite can be injected:
$ mce-inject mce-test/cases/coverage/soft-inj/recoverable_ucr/data/srao_mem_scrub
mce-test:
In addition a more in-depth test of the Linux kernel machine check facilities can be done with the mce-test test suite. mce-test supports testing uncorrected error handling, real error injection, handling of different soft offlining cases, and other tests.
Corrected memory error injection:
To inject corrected memory errors:
Remove sb_edac and edac_core kernel modules: rmmod sb_edac rmmod edac_core
Insert einj module: modprobe einj param_extension=1
Inject an error by specifying details (last command should be repeated at least two times):
$ APEI_IF=/sys/kernel/debug/apei/einj
$ echo 0x8 > $APEI_IF/error_type
$ echo 0x01f5591000 > $APEI_IF/param1
$ echo 0xfffffffffffff000 > $APEI_IF/param2
$ echo 1 > $APEI_IF/notrigger
$ echo 1 > $APEI_IF/error_inject
Check the MCE statistic: mcelog –client. Check the mcelog log for injected error details: less /var/log/mcelog.
Open vSwitch Plugins
OvS Plugins Repo: https://github.com/collectd/collectd
OvS Plugins Branch: master
OvS Events MIBs: The SNMP OVS interface link status is provided by standard IF-MIB (http://www.net-snmp.org/docs/mibs/IF-MIB.txt)
Dependencies: Open vSwitch, Yet Another JSON Library (https://github.com/lloyd/yajl)
On Centos, install the dependencies and Open vSwitch:
$ sudo yum install yajl-devel
Steps to install Open vSwtich can be found at http://docs.openvswitch.org/en/latest/intro/install/fedora/
Start the Open vSwitch service:
$ sudo service openvswitch-switch start
Configure the ovsdb-server manager:
$ sudo ovs-vsctl set-manager ptcp:6640
Clone and install the collectd ovs plugin:
$ git clone $REPO
$ cd collectd
$ git checkout master
$ ./build.sh
$ ./configure --enable-syslog --enable-logfile --enable-debug
$ make
$ sudo make install
This will install collectd to default folder /opt/collectd. The collectd
configuration file (collectd.conf) can be found at /opt/collectd/etc.
To configure the OVS events plugin you need to modify the configuration file to include:
<LoadPlugin ovs_events>
   Interval 1
</LoadPlugin>
<Plugin ovs_events>
   Port "6640"
   Address "127.0.0.1"
   Socket "/var/run/openvswitch/db.sock"
   Interfaces "br0" "veth0"
   SendNotification true
</Plugin>
To configure the OVS stats plugin you need to modify the configuration file to include:
<LoadPlugin ovs_stats>
   Interval 1
</LoadPlugin>
<Plugin ovs_stats>
   Port "6640"
   Address "127.0.0.1"
   Socket "/var/run/openvswitch/db.sock"
   Bridges "br0"
</Plugin>
For more information on the plugin parameters, please see: https://github.com/collectd/collectd/blob/master/src/collectd.conf.pod
OVS PMD stats
Repo: https://gerrit.opnfv.org/gerrit/barometer
Prequistes: 1. Open vSwitch dependencies are installed. 2. Open vSwitch service is running. 3. Ovsdb-server manager is configured. You can refer Open vSwitch Plugins section above for each one of them.
OVS PMD stats application is run through the exec plugin.
To configure the OVS PMD stats application you need to modify the exec plugin configuration to include:
<LoadPlugin exec>
   Interval 1
</LoadPlugin
<Plugin exec>
    Exec "user:group" "<path to ovs_pmd_stat.sh>"
</Plugin>
Note
Exec plugin configuration has to be changed to use appropriate user before starting collectd service.
ovs_pmd_stat.sh calls the script for OVS PMD stats application with its argument:
sudo python /usr/local/src/ovs_pmd_stats.py" "--socket-pid-file"
"/var/run/openvswitch/ovs-vswitchd.pid"
SNMP Agent Plugin
Repo: https://github.com/collectd/collectd
Branch: master
Dependencies: NET-SNMP library
Start by installing net-snmp and dependencies.
On Centos 7:
$ sudo yum install net-snmp net-snmp-libs net-snmp-utils net-snmp-devel
$ sudo systemctl start snmpd.service
go to the snmp configuration steps.
From source:
Clone and build net-snmp:
$ git clone https://github.com/haad/net-snmp.git
$ cd net-snmp
$ ./configure --with-persistent-directory="/var/net-snmp" --with-systemd --enable-shared --prefix=/usr
$ make
Become root
$ make install
Copy default configuration to persistent folder:
$ cp EXAMPLE.conf /usr/share/snmp/snmpd.conf
Set library path and default MIB configuration:
$ cd ~/
$ echo export LD_LIBRARY_PATH=/usr/lib >> .bashrc
$ net-snmp-config --default-mibdirs
$ net-snmp-config --snmpconfpath
Configure snmpd as a service:
$ cd net-snmp
$ cp ./dist/snmpd.service /etc/systemd/system/
$ systemctl enable snmpd.service
$ systemctl start snmpd.service
Add the following line to snmpd.conf configuration file
/etc/snmp/snmpd.conf to make all OID tree visible for SNMP clients:
view systemview included .1
To verify that SNMP is working you can get IF-MIB table using SNMP client to view the list of Linux interfaces:
$ snmpwalk -v 2c -c public localhost IF-MIB::interfaces
Get the default MIB location:
$ net-snmp-config --default-mibdirs
/opt/stack/.snmp/mibs:/usr/share/snmp/mibs
Install Intel specific MIBs (if needed) into location received by
net-snmp-config command (e.g. /usr/share/snmp/mibs).
$ git clone https://gerrit.opnfv.org/gerrit/barometer.git
$ sudo cp -f barometer/mibs/*.txt /usr/share/snmp/mibs/
$ sudo systemctl restart snmpd.service
Clone and install the collectd snmp_agent plugin:
$ cd ~
$ git clone https://github.com/collectd/collectd
$ cd collectd
$ ./build.sh
$ ./configure --enable-syslog --enable-logfile --enable-debug --enable-snmp --with-libnetsnmp
$ make
$ sudo make install
This will install collectd to default folder /opt/collectd. The collectd
configuration file (collectd.conf) can be found at /opt/collectd/etc.
SNMP Agent plugin is a generic plugin and cannot work without configuration. To configure the snmp_agent plugin you need to modify the configuration file to include OIDs mapped to collectd types. The following example maps scalar memAvailReal OID to value represented as free memory type of memory plugin:
LoadPlugin snmp_agent
<Plugin "snmp_agent">
  <Data "memAvailReal">
    Plugin "memory"
    Type "memory"
    TypeInstance "free"
    OIDs "1.3.6.1.4.1.2021.4.6.0"
  </Data>
</Plugin>
The snmpwalk command can be used to validate the collectd configuration:
$ snmpwalk -v 2c -c public localhost 1.3.6.1.4.1.2021.4.6.0
UCD-SNMP-MIB::memAvailReal.0 = INTEGER: 135237632 kB
Limitations
Object instance with Counter64 type is not supported in SNMPv1. When GetNext request is received, Counter64 type objects will be skipped. When Get request is received for Counter64 type object, the error will be returned.
Interfaces that are not visible to Linux like DPDK interfaces cannot be retreived using standard IF-MIB tables.
For more information on the plugin parameters, please see: https://github.com/collectd/collectd/blob/master/src/collectd.conf.pod
For more details on AgentX subagent, please see: http://www.net-snmp.org/tutorial/tutorial-5/toolkit/demon/
virt plugin
Repo: https://github.com/collectd/collectd
Branch: master
Dependencies: libvirt (https://libvirt.org/), libxml2
On Centos, install the dependencies:
$ sudo yum install libxml2-devel libpciaccess-devel yajl-devel device-mapper-devel
Install libvirt:
Note
libvirt version in package manager might be quite old and offer only limited functionality. Hence, building and installing libvirt from sources is recommended. Detailed instructions can bet found at: https://libvirt.org/compiling.html
$ sudo yum install libvirt-devel
Certain metrics provided by the plugin have a requirement on a minimal version of the libvirt API. File system information statistics require a Guest Agent (GA) to be installed and configured in a VM. User must make sure that installed GA version supports retrieving file system information. Number of Performance monitoring events metrics depends on running libvirt daemon version.
Note
Please keep in mind that RDT metrics (part of Performance monitoring events) have to be supported by hardware. For more details on hardware support, please see: https://github.com/01org/intel-cmt-cat
Additionally perf metrics cannot be collected if Intel RDT plugin is enabled.
libvirt version can be checked with following commands:
$ virsh --version
$ libvirtd --version
Statistic |
Min. libvirt API version |
Requires GA |
|---|---|---|
Domain reason |
0.9.2 |
No |
Disk errors |
0.9.10 |
No |
Job statistics |
1.2.9 |
No |
File system information |
1.2.11 |
Yes |
Performance monitoring events |
1.3.3 |
No |
Start libvirt daemon:
$ systemctl start libvirtd
Create domain (VM) XML configuration file. For more information on domain XML format and examples, please see: https://libvirt.org/formatdomain.html
Note
Installing additional hypervisor dependencies might be required before deploying virtual machine.
Create domain, based on created XML file:
$ virsh define DOMAIN_CFG_FILE.xml
Start domain:
$ virsh start DOMAIN_NAME
Check if domain is running:
$ virsh list
Check list of available Performance monitoring events and their settings:
$ virsh perf DOMAIN_NAME
Enable or disable Performance monitoring events for domain:
$ virsh perf DOMAIN_NAME [--enable | --disable] EVENT_NAME --live
Clone and install the collectd virt plugin:
$ git clone $REPO
$ cd collectd
$ ./build.sh
$ ./configure --enable-syslog --enable-logfile --enable-debug
$ make
$ sudo make install
Where $REPO is equal to information provided above.
This will install collectd to /opt/collectd. The collectd configuration file
collectd.conf can be found at /opt/collectd/etc.
To load the virt plugin user needs to modify the configuration file to include:
LoadPlugin virt
Additionally, user can specify plugin configuration parameters in this file,
such as connection URL, domain name and much more. By default extended virt plugin
statistics are disabled. They can be enabled with ExtraStats option.
<Plugin virt>
   RefreshInterval 60
   ExtraStats "cpu_util disk disk_err domain_state fs_info job_stats_background pcpu perf vcpupin"
</Plugin>
For more information on the plugin parameters, please see: https://github.com/collectd/collectd/blob/master/src/collectd.conf.pod
Installing collectd as a service
NOTE: In an OPNFV installation, collectd is installed and configured as a service.
Collectd service scripts are available in the collectd/contrib directory. To install collectd as a service:
$ sudo cp contrib/systemd.collectd.service /etc/systemd/system/
$ cd /etc/systemd/system/
$ sudo mv systemd.collectd.service collectd.service
$ sudo chmod +x collectd.service
Modify collectd.service
[Service]
ExecStart=/opt/collectd/sbin/collectd
EnvironmentFile=-/opt/collectd/etc/
EnvironmentFile=-/opt/collectd/etc/
CapabilityBoundingSet=CAP_SETUID CAP_SETGID
Reload
$ sudo systemctl daemon-reload
$ sudo systemctl start collectd.service
$ sudo systemctl status collectd.service should show success
Additional useful plugins
Exec Plugin : Can be used to show you when notifications are being generated by calling a bash script that dumps notifications to file. (handy for debug). Modify /opt/collectd/etc/collectd.conf:
LoadPlugin exec
<Plugin exec>
#   Exec "user:group" "/path/to/exec"
   NotificationExec "user" "<path to barometer>/barometer/src/collectd/collectd_sample_configs/write_notification.sh"
</Plugin>
write_notification.sh (just writes the notification passed from exec through STDIN to a file (/tmp/notifications)):
#!/bin/bash
rm -f /tmp/notifications
while read x y
do
  echo $x$y >> /tmp/notifications
done
output to /tmp/notifications should look like:
Severity:WARNING
Time:1479991318.806
Host:localhost
Plugin:ovs_events
PluginInstance:br-ex
Type:gauge
TypeInstance:link_status
uuid:f2aafeec-fa98-4e76-aec5-18ae9fc74589

linkstate of "br-ex" interface has been changed to "DOWN"
logfile plugin: Can be used to log collectd activity. Modify /opt/collectd/etc/collectd.conf to include:
LoadPlugin logfile
<Plugin logfile>
    LogLevel info
    File "/var/log/collectd.log"
    Timestamp true
    PrintSeverity false
</Plugin>
Monitoring Interfaces and Openstack Support
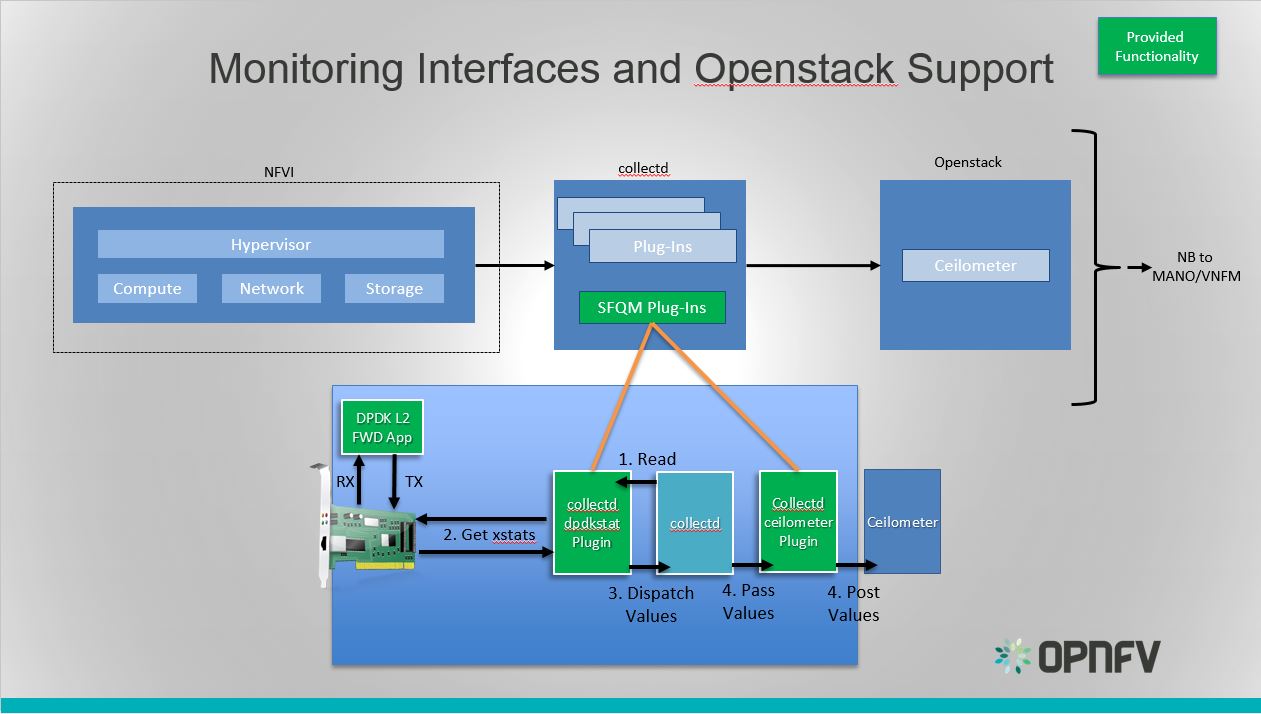
Monitoring Interfaces and Openstack Support
The figure above shows the DPDK L2 forwarding application running on a compute node, sending and receiving traffic. Collectd is also running on this compute node retrieving the stats periodically from DPDK through the dpdkstat plugin and publishing the retrieved stats to OpenStack through the collectd-openstack-plugins.
To see this demo in action please checkout: Barometer OPNFV Summit demo
For more information on configuring and installing OpenStack plugins for collectd, check out the collectd-openstack-plugins GSG.
Security
AAA – on top of collectd there secure agents like SNMP V3, Openstack agents etc. with their own AAA methods.
Collectd runs as a daemon with root permissions.
The Exec plugin allows the execution of external programs but counters the security concerns by:
Ensuring that only one instance of the program is executed by collectd at any time
Forcing the plugin to check that custom programs are never executed with superuser
privileges.
Protection of Data in flight:
It’s recommend to use a minimum version of 4.7 of the Network plugin which provides the possibility to cryptographically sign or encrypt the network traffic.
Write Redis plugin or the Write MongoDB plugin are recommended to store the data.
For more information, please see: https://collectd.org/wiki/index.php?title=Networking_introduction
Known vulnerabilities include:
https://www.cvedetails.com/vulnerability-list/vendor_id-11242/Collectd.html
CVE-2017-7401 fixed https://github.com/collectd/collectd/issues/2174 in Version 5.7.2.
- CVE-2016-6254 fixed https://mailman.verplant.org/pipermail/collectd/2016-July/006838.html
in Version 5.4.3.
- CVE-2010-4336 fixed https://mailman.verplant.org/pipermail/collectd/2010-November/004277.html
in Version 4.10.2.
http://www.cvedetails.com/product/20310/Collectd-Collectd.html?vendor_id=11242
It’s recommended to only use collectd plugins from signed packages.